
IELTS Academic Writing Task 1
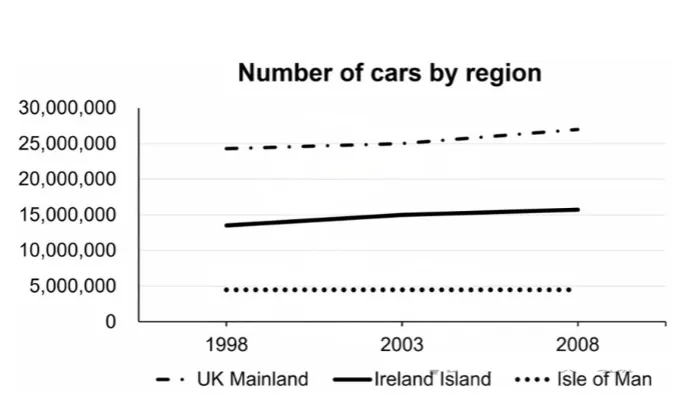
The graph below shows the number of cars in three regions in the UK from 1998 to 2008.
Line graph
2025.5.17

Question Image
小作文题图
IELTS Academic Writing Task 1