IELTS Academic Writing Task 1
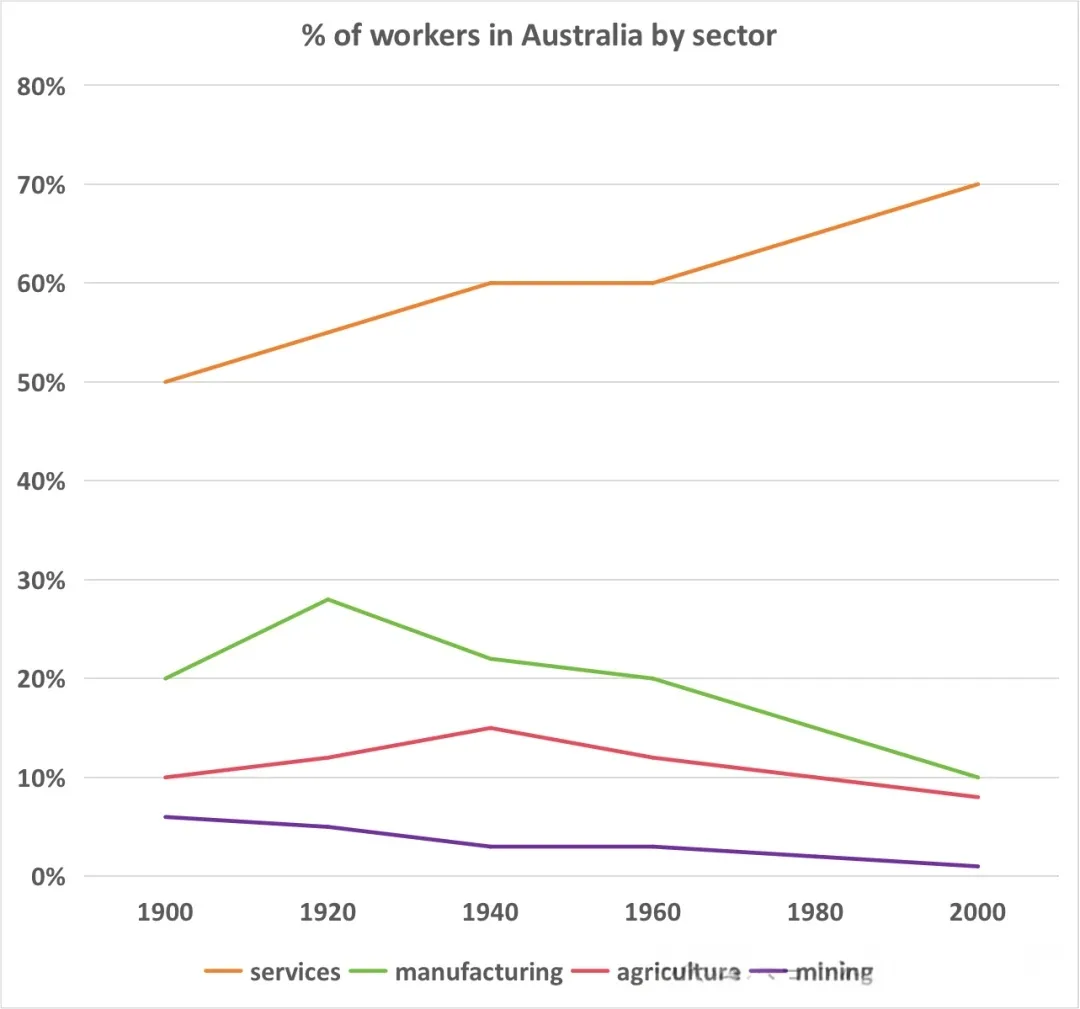
The graph below shows the proportion of workers employed by four different sectors in Australia from 1990 to 2000.
Line graph
2025.8.30

Question Image
小作文题图