IELTS Academic Writing Task 1
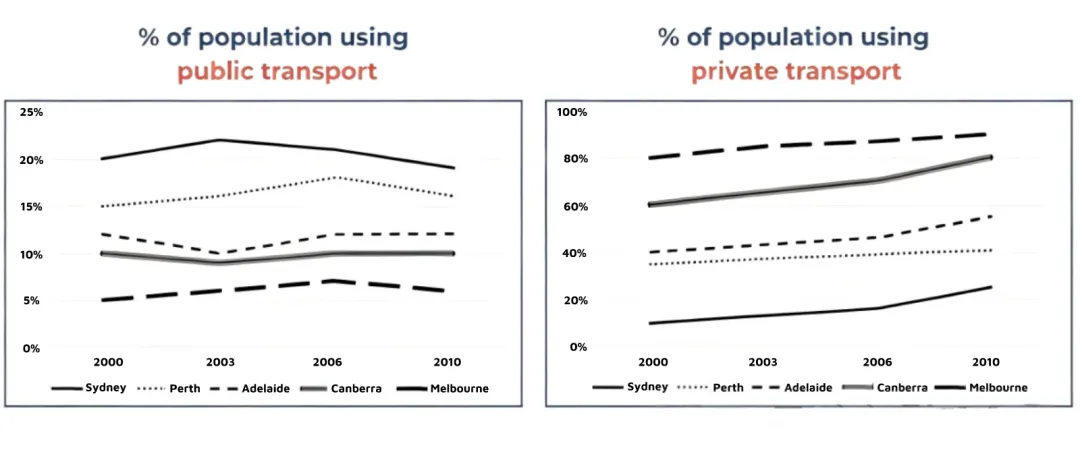
The line graphs show the percentage of people using public transport and people using private cars in five cities of Australia from 2000 to 2010.
Line graph
2025.11.1

Question Image
小作文题图