

Describing Trends
Describing Trends Lesson
写作技巧
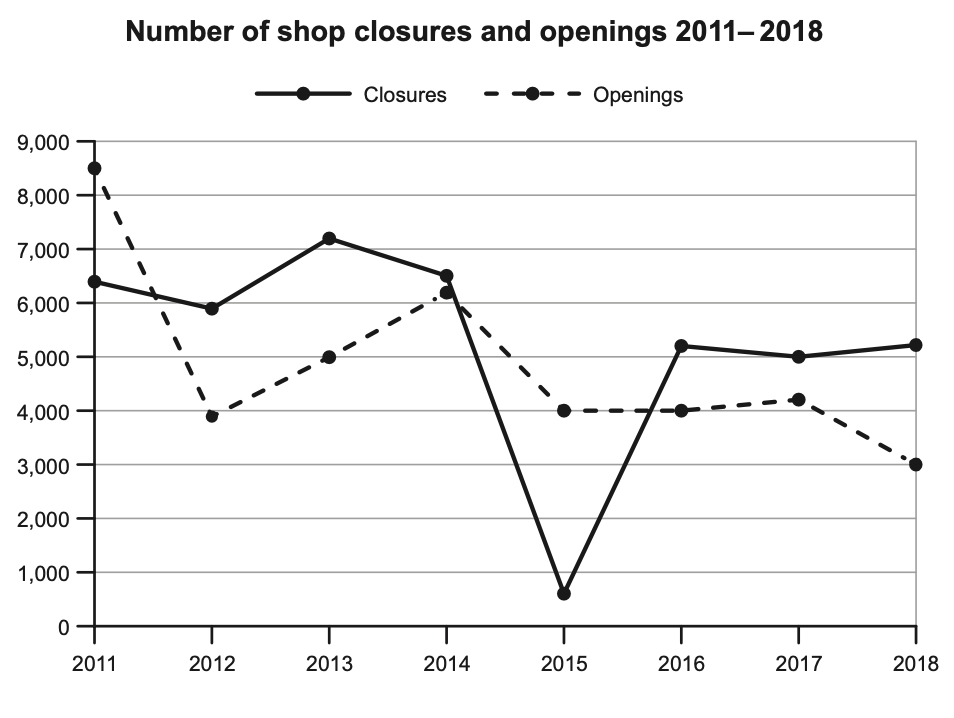
Line Graph & Bar Chart CLASS 重点:描述趋势,突出比较/对比,丰富的词汇短语和语法结构** 练习1 The graph below shows the number of shops that closed and the number of new
重点:描述趋势,突出比较/对比,丰富的词汇短语和语法结构
练习1
The graph below shows the number of shops that closed and the number of new shops that opened in one country between 2011 and 2018.
Summarise the information by selecting and reporting the main features, and make comparisons where relevant.
1) Introduction (同义句替换)
The given line graph __ the number of __ in a country __.
2) Overview (指出宏观的特征对比)
Overall, both shop closures and openings experienced a net decrease over the eight years, with closures generally displaying a more varied trend and consistently outnumbering openings in most years.
3) Body paragraph 1 (2011-2014) 建议使用“based on the given data”/“according to the information”/“regarding the data”/“based on the statistics,” 等开头,或者直接用时间开头,描述第一年 (”In 2011, ”)
Based on the statistics, ___
4) Body paragraph 2 (2014-2018)
Tip: 不需要写出所有的信息/细节,但是写出开始点,结束点,重要变化,转折点很关键。
可用表达:
条形图
重点:描述相似和不同的比较/对比,变化趋势,丰富的词汇短语和语法结构
练习2
The following bar chart shows the amount of annual electricity production in millions of Kilowatts using renewables for three countries from 1980 to 2010.
Summarize the information by reporting the main features and make comparisons where relevant.
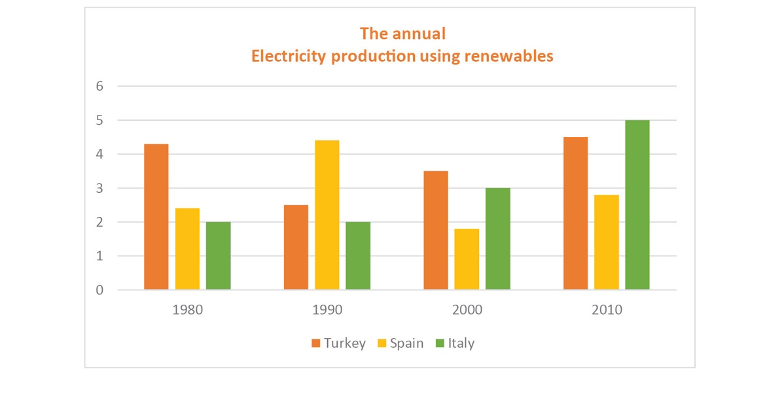
Overall, 三个国家的新能源电产量都有不同程度的上升,其中意大利的增长最明显,是以前的 2.5 倍。
1) Introduction (同义句替换)
2) Overview(指出宏观的特征对比)
Overall, both Turkey and Italy show an upward trend in their annual electricity production over the given period, whereas the trend for Spain displays some fluctuations.
3) Body paragraph 1(描述关键细节,突出比较/对比)
According to the data, Turkey produced slightly above 4 million Kilowatts of electricity in 1980; however, this amount almost halved a decade later, when a gradual rise made it reach its highest amount of electricity production with nearly 4.5 million. On the other hand, Italy had much lower production of electricity at 2 million Kilowatts at the beginning of the period, and stabilized until 1990; however, in 2000, it experienced a gradual growth to 3 million in its annual production followed by a sharp increase to a peak of 5 million in 2010.
这一段虽然单独描述了趋势,但是通过不同的比较结构和词汇也明显展示了比较。
4) Body paragraph 2 (描述关键细节,突出比较/对比)
In contrast, the trend for Spain varied drastically over the period. ___